The use of computers to process brain signals opens up an infinite number of ways of extracting useful information. Once the digitized EEG channels are stored into the computer's memory, powerful mathematical techniques can be developed to unravel the meaning of its apparently random wigglings.
 One
of them, seen in this picture, is called spectral analysis. It is
a mathematical technique, developed by a French scientist called Pierre
Fourier, at the turn of the last century, which is able to show the frequency
components of a wave (i.e., how much of each of the pure waves alpha, beta,
theta, delta, etc.) are present and mixed in a single channel recording).
What you see here is a tridimensional diagram showing the time axis from
left to right, the frequency component orthogonal to it, and the intensity
in microvolts on the vertical axis. A color scale is used to differentiate
amplitudes.
One
of them, seen in this picture, is called spectral analysis. It is
a mathematical technique, developed by a French scientist called Pierre
Fourier, at the turn of the last century, which is able to show the frequency
components of a wave (i.e., how much of each of the pure waves alpha, beta,
theta, delta, etc.) are present and mixed in a single channel recording).
What you see here is a tridimensional diagram showing the time axis from
left to right, the frequency component orthogonal to it, and the intensity
in microvolts on the vertical axis. A color scale is used to differentiate
amplitudes.
 Another
recent development is the use of powerful graphical processing software
to render three-dimensional reconstructions of the head and of the brain,
where the electrical activity parameters recorded in the EEG brain topography
are depicted as 3D color maps. Dynamic video animations can be produced,
showing the alterations of electrical activity as a function of time.
Another
recent development is the use of powerful graphical processing software
to render three-dimensional reconstructions of the head and of the brain,
where the electrical activity parameters recorded in the EEG brain topography
are depicted as 3D color maps. Dynamic video animations can be produced,
showing the alterations of electrical activity as a function of time.

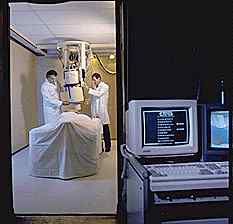 The
future of quantitative EEG for clinical applications lies, undoubtedly,
in the coupling of digital methods of signal analysis and of image processing.
In this picture, what you see is the combination of two remarkable devices:
the magnetic resonance scanner (MRI), which produces anatomical
or functional images of the brain with great detail and clarity, and the
magnetoencephalograph (MEG). The MEG is capable of recording minute
alterations in the electromagnetic field, generated by the electrical activity
of neurons deep within the brain. In order to do this, it uses a magnetic
pick-up coil immersed into liquid helium, named SQUID, thus achieving the
phenomenon of electrical superconductivity. The resulting record is superimposed
upon the anatomical image generated by the MRI scanner.
The
future of quantitative EEG for clinical applications lies, undoubtedly,
in the coupling of digital methods of signal analysis and of image processing.
In this picture, what you see is the combination of two remarkable devices:
the magnetic resonance scanner (MRI), which produces anatomical
or functional images of the brain with great detail and clarity, and the
magnetoencephalograph (MEG). The MEG is capable of recording minute
alterations in the electromagnetic field, generated by the electrical activity
of neurons deep within the brain. In order to do this, it uses a magnetic
pick-up coil immersed into liquid helium, named SQUID, thus achieving the
phenomenon of electrical superconductivity. The resulting record is superimposed
upon the anatomical image generated by the MRI scanner.
In this figure, points of altered electrical activity (epileptic areas) are shown as colored circles, placed over the areas where the MEG apparatus was able to determine its location.
The increased sophistication and number of resources available on computerized
EEG systems and of medical imaging processing will continue to evolve.
Quantitative, high resolution EEG has a bright future as a tool in the
medical diagnostic work-up.
See picture credits
|
From: EEG Brain Mapping Author: Renato M.E. Sabbatini, PhD In: Brain & Mind Magazine, August/September 1997. |

 3 of 4 pages |